Income

Where Housing Got Even More Unaffordable: Trends from 2017 to 2022

Introduction The United States housing market has experienced significant shifts in recent years, with some regions seeing dramatic changes in affordability. Using data on home prices, adjusted for inflation, and median household incomes, this analysis maps the change in the home price-to-income ratio from 2017 to 2022. The findings highlight regional disparities and provide valuable […]

Where Housing Got Even More Unaffordable: Trends from 2017 to 2022 Read More »
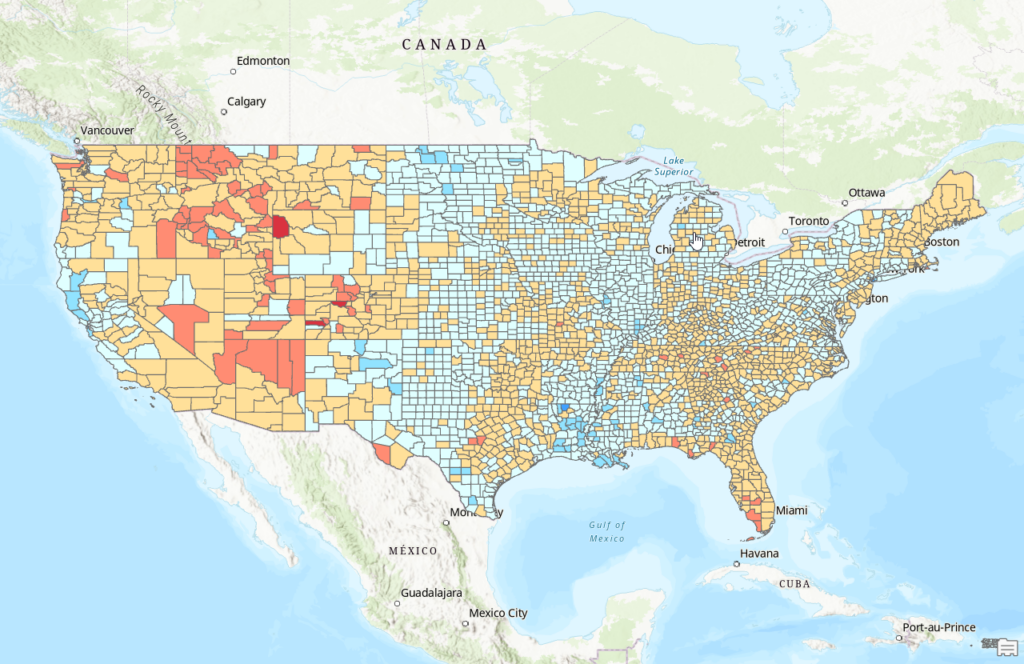
Where Can You Afford to Live? Mapping Housing Affordabilty Across the West

[et_pb_section fb_built=”1″ _builder_version=”4.16″ global_colors_info=”{}”][et_pb_row _builder_version=”4.16″ background_size=”initial” background_position=”top_left” background_repeat=”repeat” global_colors_info=”{}”][et_pb_column type=”4_4″ _builder_version=”4.16″ custom_padding=”|||” global_colors_info=”{}” custom_padding__hover=”|||”][et_pb_text _builder_version=”4.16″ background_size=”initial” background_position=”top_left” background_repeat=”repeat” global_colors_info=”{}”]Housing affordability remains a critical issue in many regions, affecting individuals, policymakers, and businesses. By analyzing the home price-to-income ratio, we can better understand disparities in housing costs and identify areas where affordability challenges are most acute.

Where Can You Afford to Live? Mapping Housing Affordabilty Across the West Read More »