Census Studio
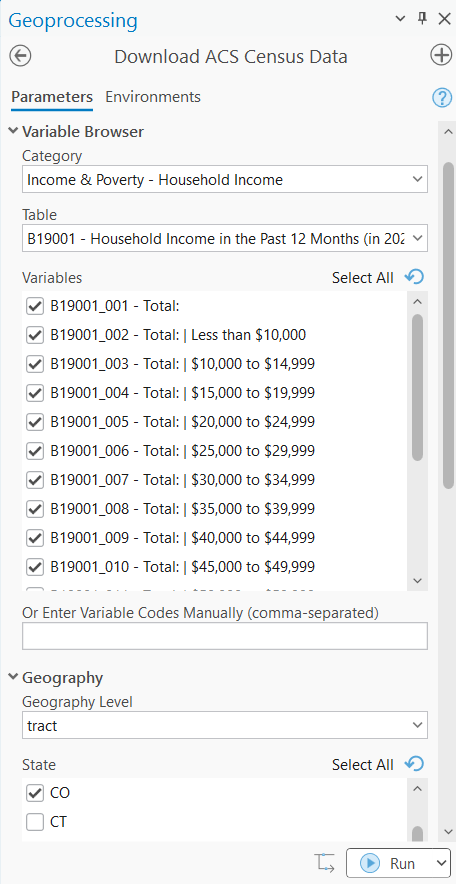
Download ACS Census Data - Features
Bring the power of the American Community Survey directly into ArcGIS Pro. This tool connects to the Census Bureau’s API through R’s tidycensus library, delivering publication-ready feature classes with both estimates and margins of error—no manual downloads, no format conversions, no hassle.
Why you’ll love it:
- Download – Census data downloaded to local feature class with attached attributes. Never leave ArcGIS Pro to obtain census data.
- Interactive variable browser — Search and select from thousands of ACS variables without memorizing table codes
- Multi-state support — Download data across state boundaries in a single operation
- Geometry included — Get analysis-ready polygon features, not just tables to join
- Multiple geography levels — From block groups to states, choose the level that fits your analysis
- Confidence level options — Select 90%, 95%, or 99% confidence intervals based on your needs
- 5-year and 1-year estimates — Access both ACS products for the years you need
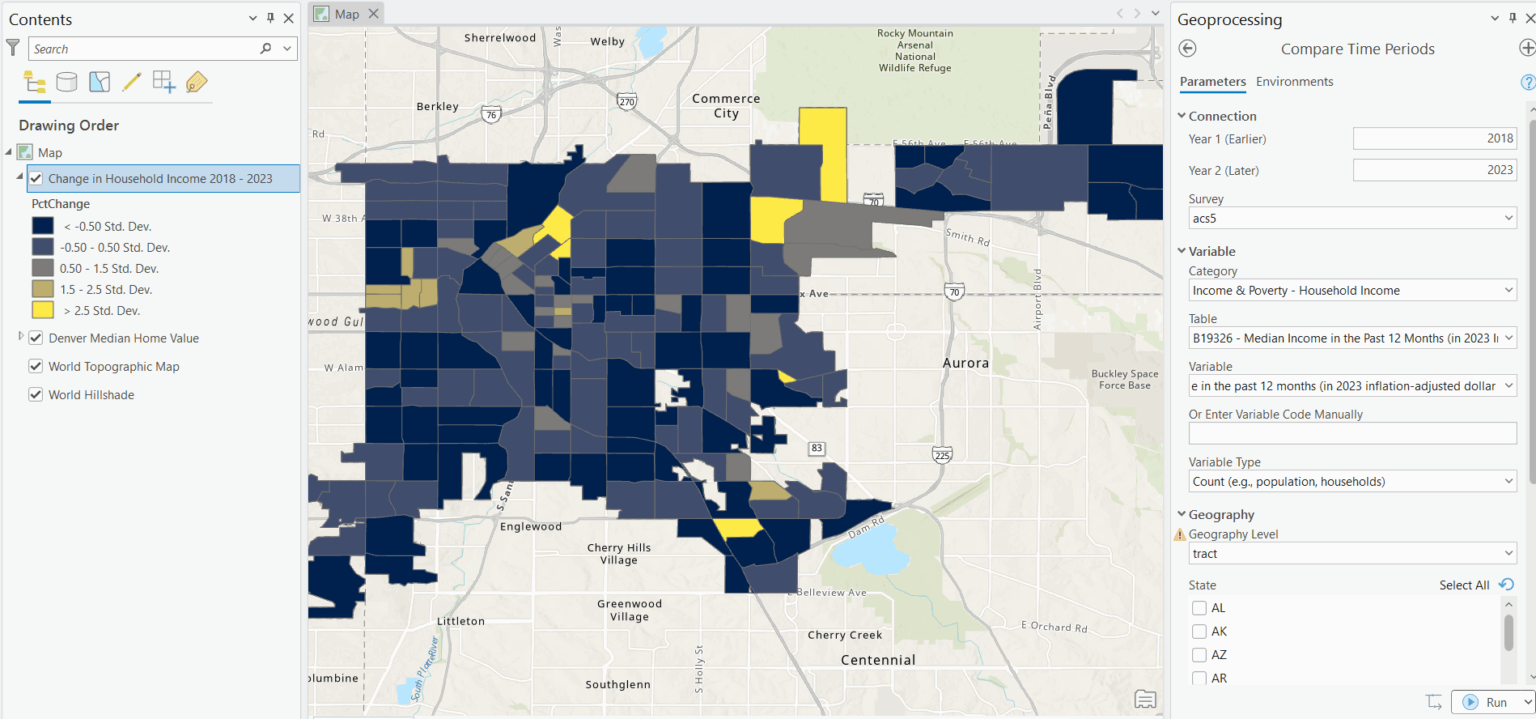
Compare Time Periods
Understand how your community has changed over time with statistically rigorous comparisons. This tool does more than subtract one year from another—it calculates whether differences are statistically significant and handles the complex challenge of changing Census boundaries across decades.
Why you’ll love it:
- Statistical significance testing — Know whether changes are real or within the margin of error
- Cross-decade boundary interpolation — Compare 2010 and 2020 data even when tract boundaries changed
- Side-by-side output — Both time periods plus the calculated change in a single feature class
- MOE-aware calculations — Proper error propagation when computing differences
- Visual change indicators — Clear fields showing direction and significance of change
Join ACS Data to Features
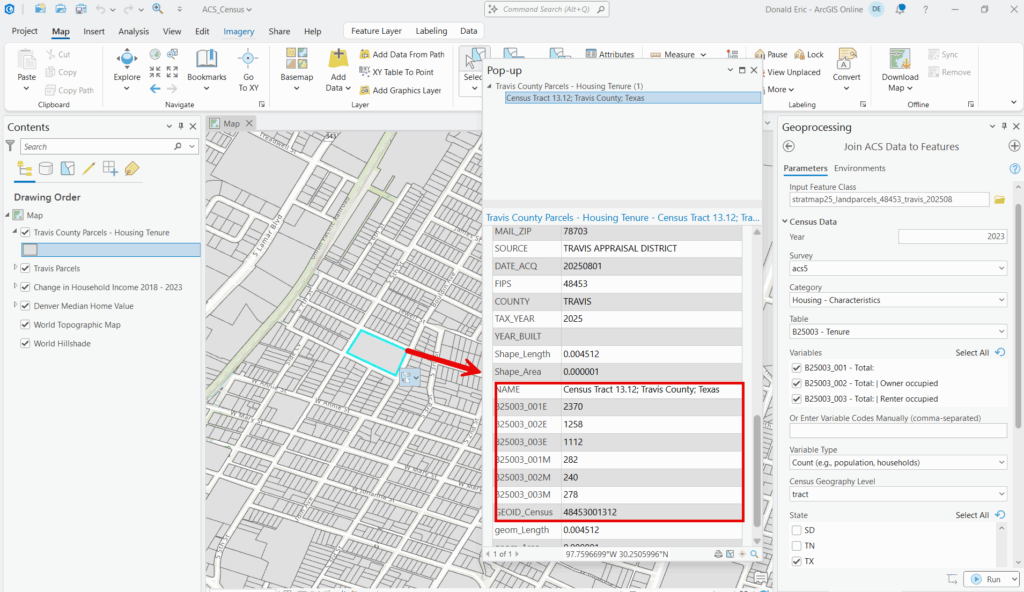
Your analysis boundaries rarely match Census geography. School districts, planning areas, sales territories, council districts—they all need demographic data assigned to custom polygons. This tool bridges that gap, transferring Census data to your features using spatial relationships.
Why you’ll love it:
- Works with any polygon layer — Parcels, districts, zones, service areas, or any custom boundary
- Population-weighted joins — Assign demographics proportionally based on where people actually live
- Centroid-based option — Fast processing for large datasets when precision isn’t critical
- Preserves MOE values — Margin of error fields transfer to your output for quality assessment
- Handles complex relationships — One Census tract to many parcels, many tracts to one district—it works
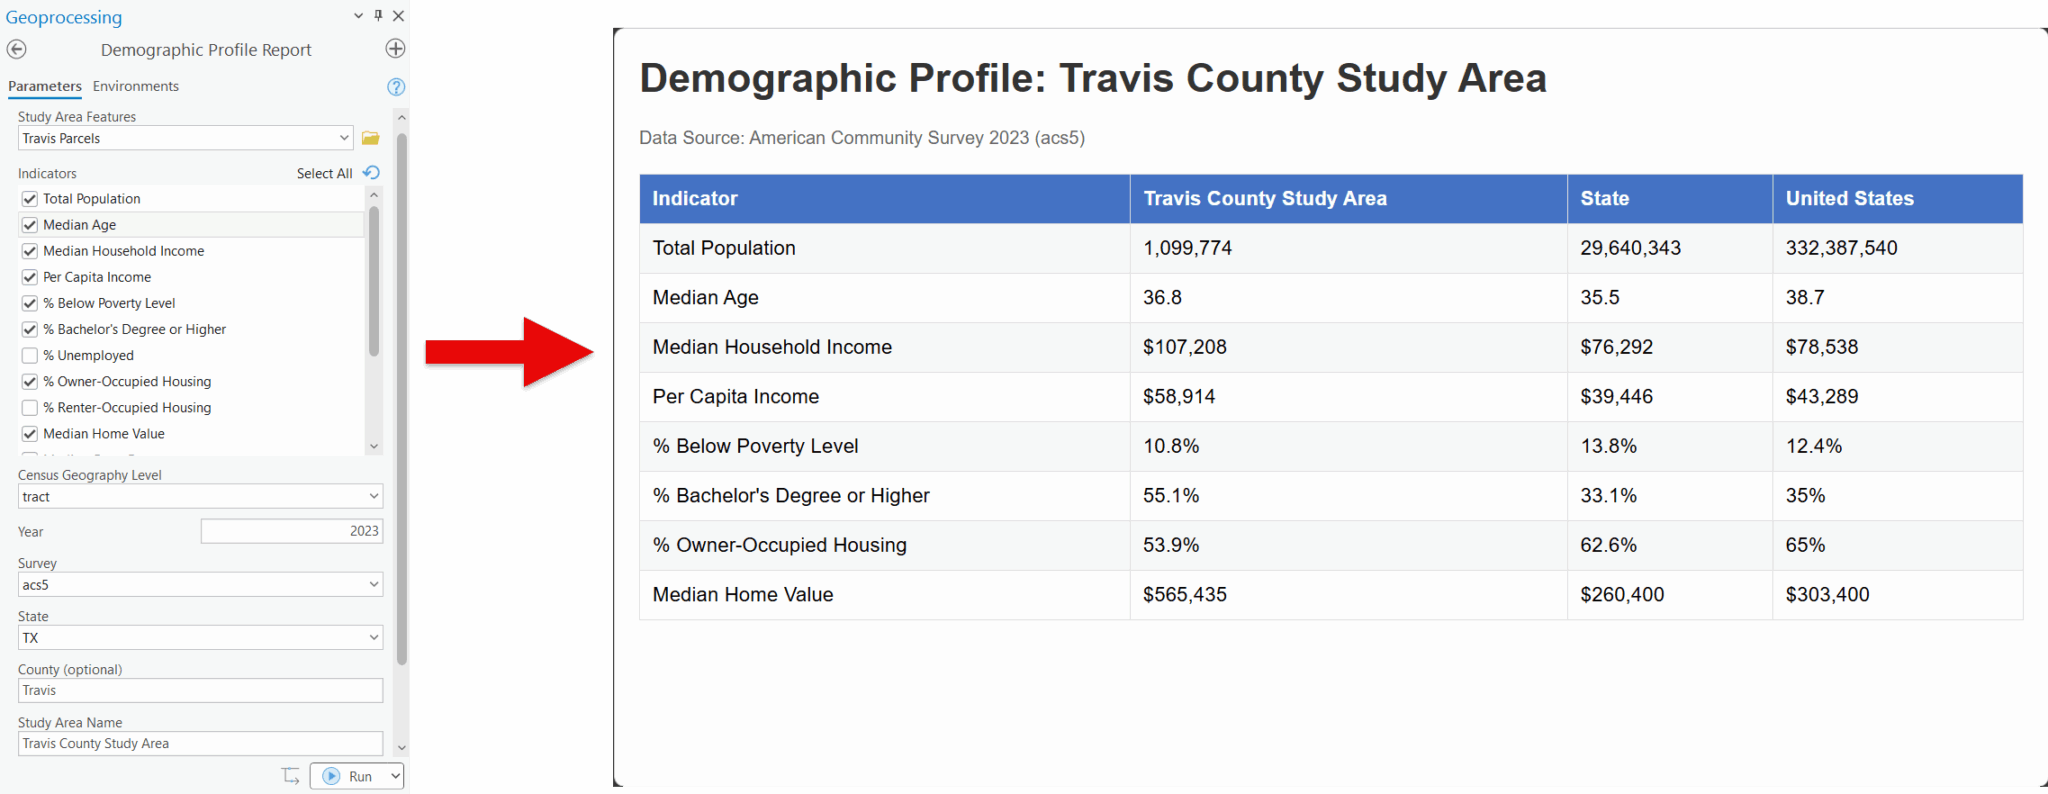
Demographic Profile Report
How does your study area compare to the bigger picture? This tool generates comprehensive demographic profiles comparing any geography to its containing county, state, and national averages—complete with statistical significance indicators.
Why you’ll love it:
- Automatic benchmark comparisons — Study area vs. county vs. state vs. nation in one report
- Key demographic indicators — Population, age, income, education, housing, and more
- Statistical significance flags — Know which differences are meaningful, not just different
- Area-weighted aggregation — Properly combines multiple Census geographies into your study area
- Report-ready output — Formatted results ready for planning documents and presentations
Hot Spot Analysis
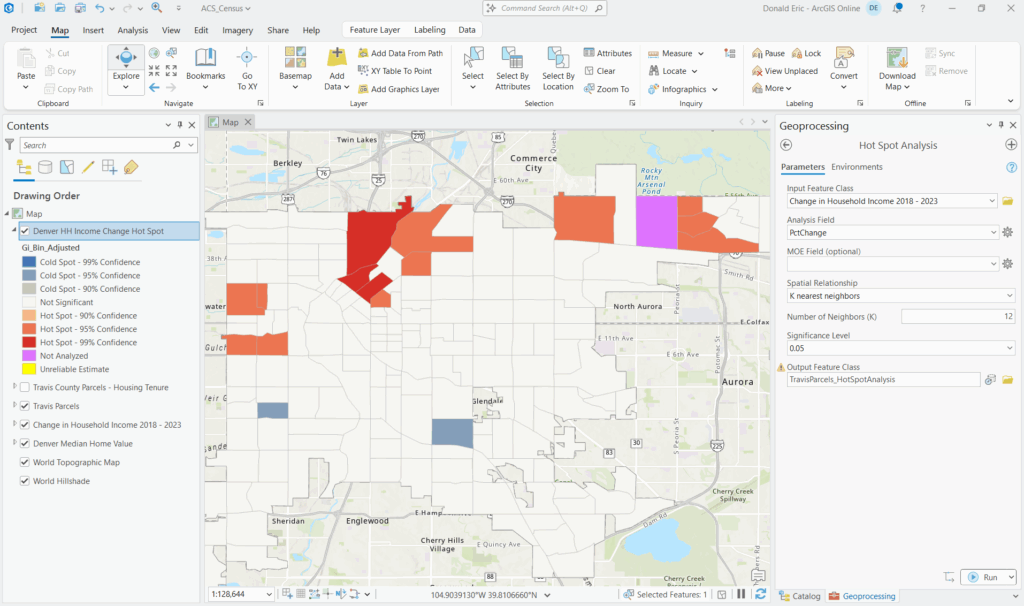
Find clusters of high and low values with statistical confidence. Unlike standard hot spot tools that ignore data quality, this analysis adjusts for margin of error—so you’re finding real patterns, not mapping noise.
Why you’ll love it:
- Getis-Ord Gi statistic* — Industry-standard spatial clustering method
- MOE-aware significance testing — Adjusts confidence based on estimate reliability
- Identifies hot spots AND cold spots — Statistically significant highs and lows
- Includes symbology — Pre-configured layer file for immediate visualization
- Works with any numeric variable — Income, education, housing values, demographic rates
Normalize Data
Raw counts tell you how many. Rates tell you what it means. This tool transforms Census counts into percentages, per capita rates, or per-thousand rates—with mathematically correct margin of error propagation that most analysts skip.
Why you’ll love it:
- Proper MOE propagation — Calculates derived margins of error using Census Bureau formulas
- Multiple normalization types — Percentage, per capita, per 1,000, per 10,000, or custom denominators
- Flexible denominator selection — Use total population, households, housing units, or any field in your data
- Batch processing — Normalize multiple fields in one operation
- Meaningful comparisons — Finally compare small rural counties to large metro areas fairly
Margin of Error Reliability Filter
Not all ACS estimates are created equal. Small geographies and rare population groups often have margins of error larger than the estimates themselves. This tool calculates the coefficient of variation for every record and flags the data you shouldn’t trust.
Why you’ll love it:
- Coefficient of variation calculation — The standard measure of estimate reliability
- Census Bureau thresholds — High (<12%), medium (12-40%), and low (>40%) reliability classifications
- Filter or flag options — Remove unreliable records or keep them with warning flags
- Prevents bad analysis — Stop before you map meaningless data or make decisions on noise
- Essential for small areas — Block groups and small tracts need this quality check
Census Studio for ArcGIS Pro - The Complete Package
Nine tools. One mission: Make American Community Survey data accessible, reliable, and actionable in ArcGIS Pro.
What makes Census Studio different:
- Margin of error everywhere — Every tool respects and propagates data uncertainty
- R + ArcGIS integration — Leverages tidycensus power with ArcGIS Pro convenience
- Statistical rigor built in — Significance testing, error propagation, reliability filtering
- Works with your data — Join Census demographics to any polygon features you have
- Production ready — Output feature classes ready for mapping, analysis, and reporting
Stop wrestling with Census data. Start analyzing it.