[et_pb_section fb_built=”1″ _builder_version=”4.16″ global_colors_info=”{}”][et_pb_row _builder_version=”4.16″ background_size=”initial” background_position=”top_left” background_repeat=”repeat” global_colors_info=”{}”][et_pb_column type=”4_4″ _builder_version=”4.16″ custom_padding=”|||” global_colors_info=”{}” custom_padding__hover=”|||”][et_pb_text _builder_version=”4.16″ background_size=”initial” background_position=”top_left” background_repeat=”repeat” global_colors_info=”{}”]Housing affordability remains a critical issue in many regions, affecting individuals, policymakers, and businesses. By analyzing the home price-to-income ratio, we can better understand disparities in housing costs and identify areas where affordability challenges are most acute. This article explores the significance of this ratio, highlights its regional implications—particularly in the western United States—and discusses how visualizing this data can inform better decision-making.
Understanding the Home Price-to-Income Ratio
The home price-to-income ratio compares the cost of a home to the median household income in a given area. It is calculated as:
Why It Matters
- Affordable Housing Benchmark: A widely accepted standard suggests that a ratio of 3:1 or below is affordable. Ratios above this indicate potential affordability challenges.
- Regional Disparities: Areas with higher ratios often have higher living costs, making it difficult for residents to access homeownership.
- Policy Implications: Understanding where affordability challenges exist can guide housing policies, zoning regulations, and infrastructure investments.
What the Ratio Tells Us
- Low Ratios: Suggest more affordable housing markets, where home prices align closely with local incomes.
- High Ratios: Indicate areas where homeownership may be out of reach for many, often tied to high demand, limited supply, or lower incomes.
Regional Insights: Housing Affordability in the Western United States
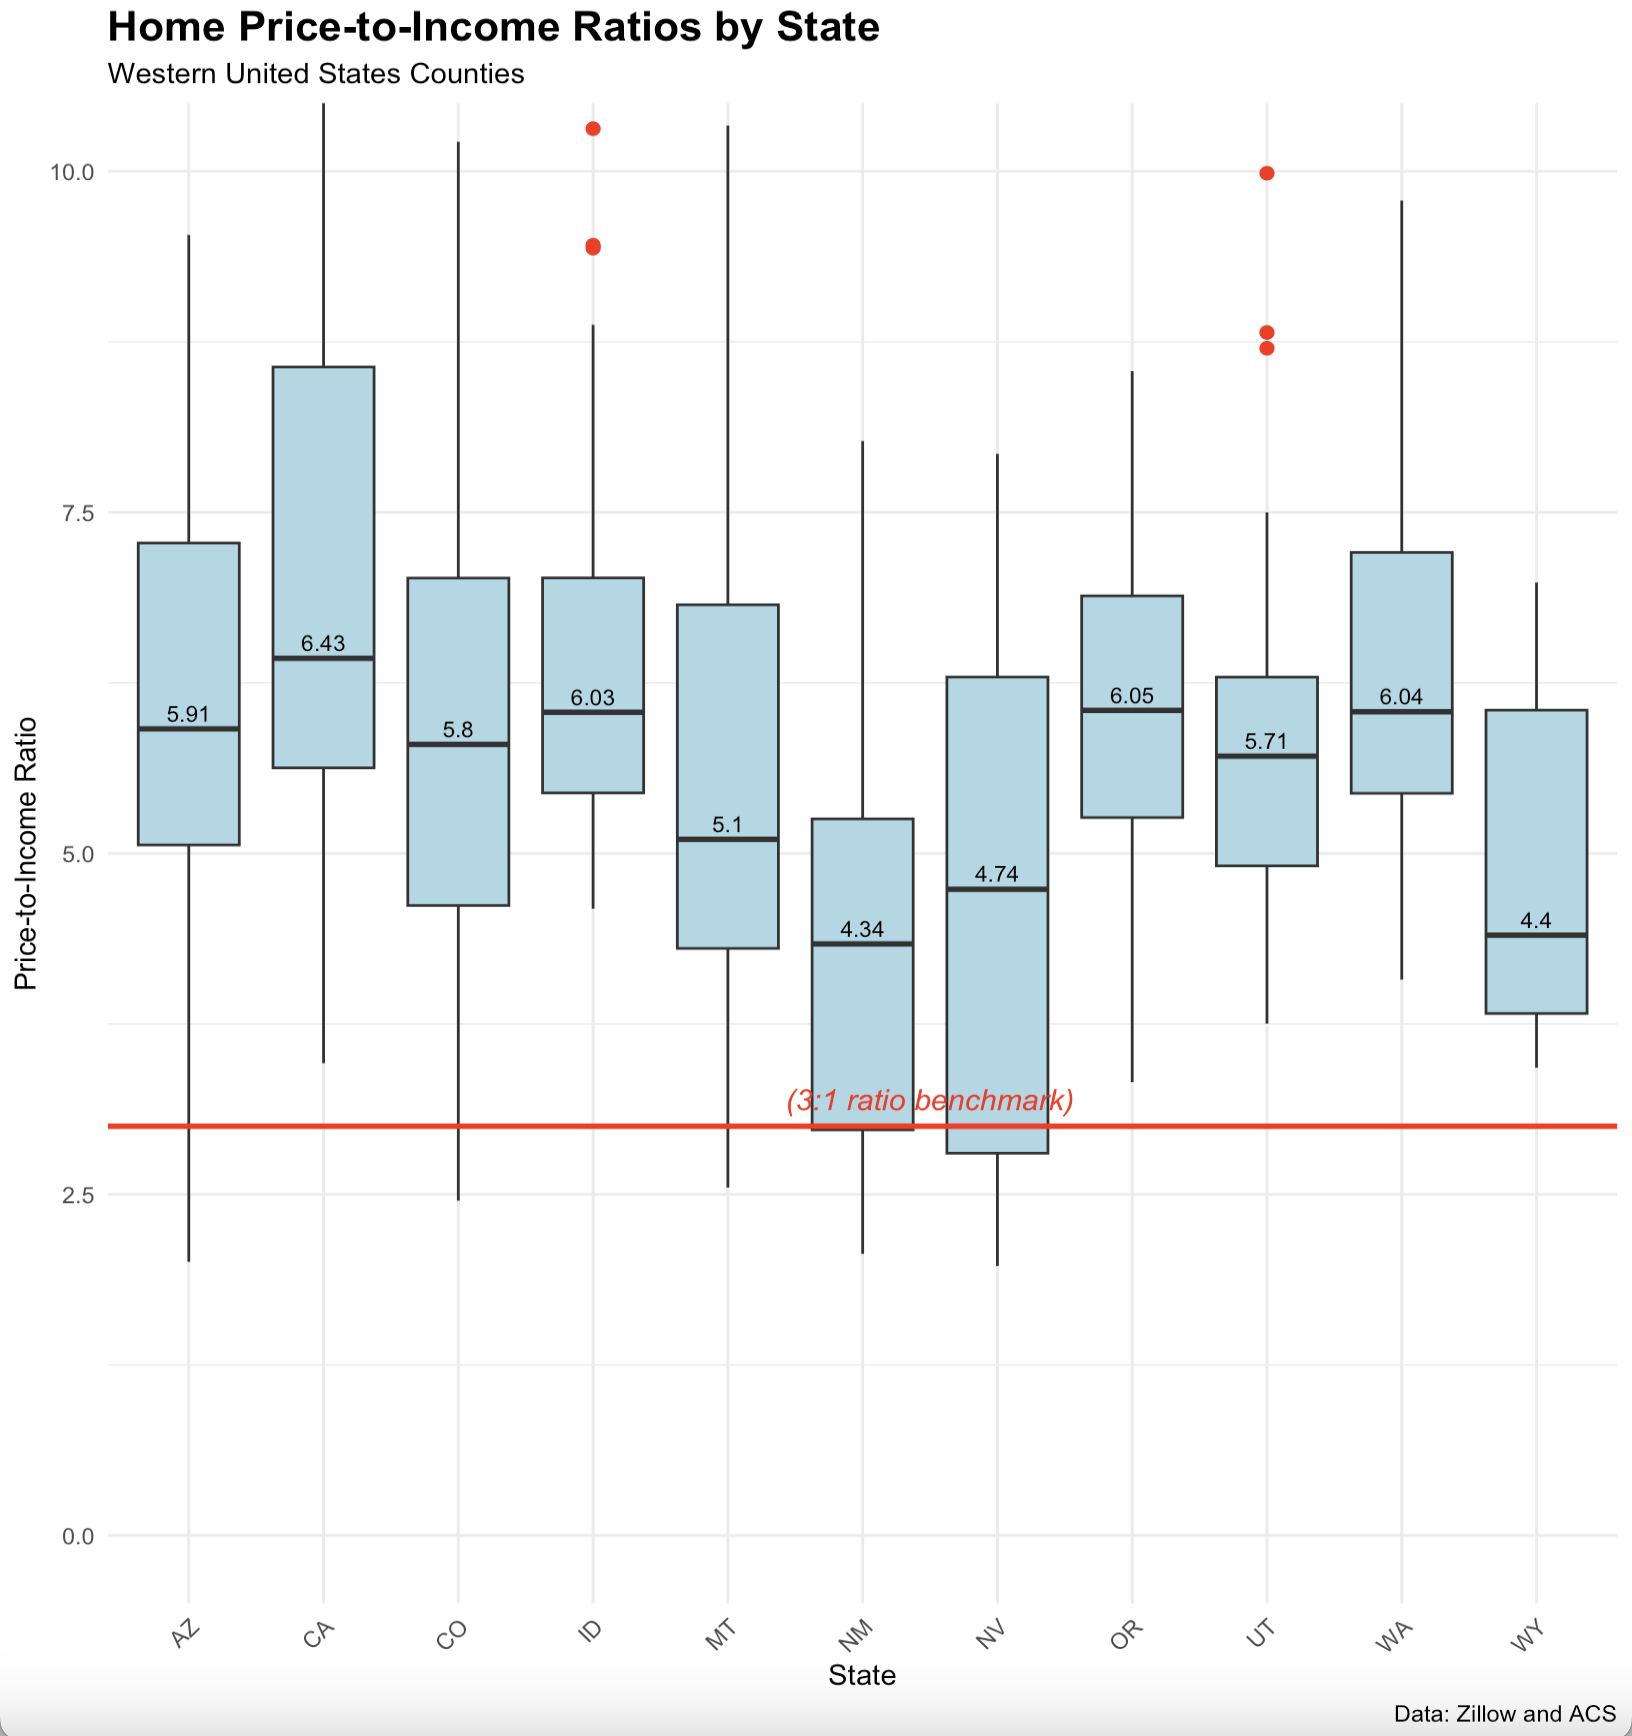
One of the most striking patterns in the home price-to-income ratio is its pronounced disparity in the western United States. This region consistently exhibits some of the highest ratios in the country, reflecting significant affordability challenges. States such as California, Washington, Idaho, and Colorado lead the nation in high ratios, while neighboring states like Arizona, Nevada, and Wyoming are not far behind. As you can see in the table below all the states exceed the 3:1 ratio, many by double.

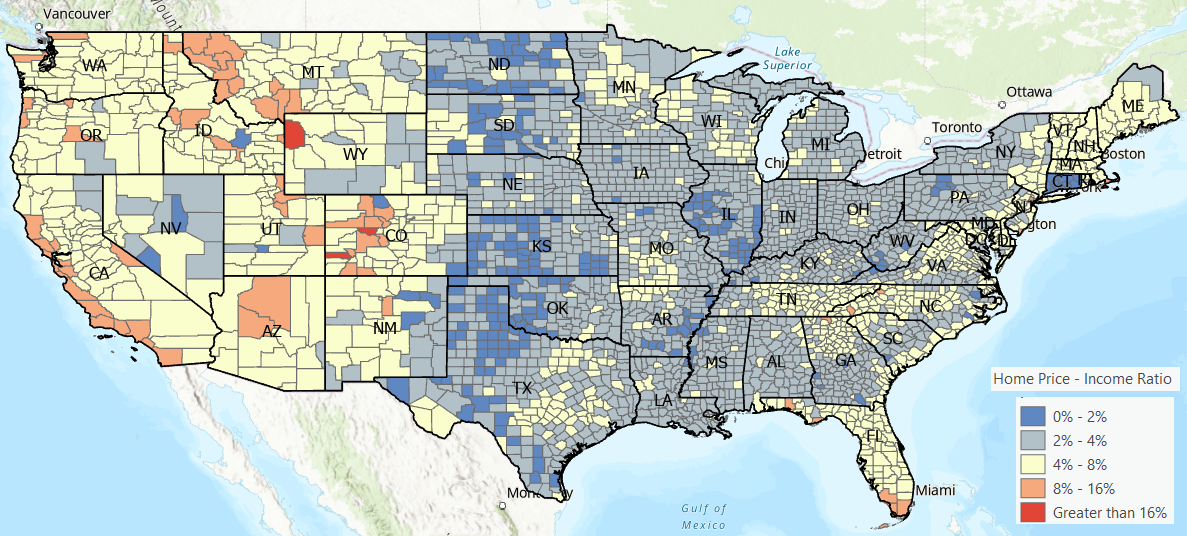
As I mentioned a 3:1 ratio is often used as a benchmark of home affordability, and as you can clear see from the county level map below most of the western United States is above this benchmark as of November 2024.

Why Are Ratios Higher in the West?
- Skyrocketing Demand:
- The western U.S. is home to economic powerhouses such as Silicon Valley, Seattle, and Denver, which attract highly skilled workers and businesses. This demand fuels competition in housing markets, driving up prices.
- Desirable climates, outdoor amenities, and lifestyle opportunities also contribute to population growth and housing demand.
- Limited Housing Supply:
- Many western states face significant housing supply constraints due to geographic and regulatory factors:
- Geographic Constraints: Mountainous terrain, deserts, and coastal zones limit where housing can be built.
- Zoning Restrictions: Many cities in the West have strict zoning laws that limit higher-density housing, reducing available supply and pushing prices higher.
- Many western states face significant housing supply constraints due to geographic and regulatory factors:
- Income Growth Lagging Behind Housing Prices:
- While wages in some western metros have grown due to booming industries like tech and tourism, they have not kept pace with the rapid escalation in home prices, creating a widening affordability gap.
A Closer Look at Key States
- California: Often the epicenter of housing affordability issues, California’s major metropolitan areas like San Francisco, Los Angeles, and San Diego frequently report home price-to-income ratios exceeding 8:1 in some counties. As you can see in the chart below, the State of California is currently at a price to income ratio of 6.43.
- Washington: The tech boom in Seattle and surrounding areas has pushed ratios well above the national average, with high home prices stretching even into suburban and rural counties. The State of Washington is current at a price to income ratio of 6.04.
- Oregon and Colorado: Urban hubs like Portland and Denver face similar challenges, where the influx of new residents has outpaced the development of affordable housing.
- Arizona and Nevada: While historically more affordable, these states are seeing significant increases in ratios, particularly in fast-growing cities like Phoenix and Las Vegas, driven by migration from neighboring California.
- The mean home price to income ratio for these western states is currently 6.26, which is well above the suggested 3:1. This means that the average home price in the western United States is over 6 times the average household income. This is more than double the affordability benchmark, indicating that housing costs in this region are far beyond what is traditionally considered affordable.

- The most unaffordable counties in these states include the following:
 |
| - The most affordable counties in these states include the following:

Comparisons with Other Regions
In contrast, regions in the Midwest and South often report lower home price-to-income ratios, reflecting a closer alignment between housing costs and incomes. For example:
- Iowa, Missouri, and Ohio typically exhibit ratios closer to the affordability benchmark of 3:1 or below. As of November 2024 the ratio for these three states is 3.23 and much more in line with traditional ratios.
- These regions benefit from a combination of lower housing demand, more available land for development, and less restrictive zoning laws.
Broader Implications of Housing Affordability
The home price-to-income ratio is not just a number—it reflects deeper socioeconomic dynamics:
- Economic Mobility: High ratios can limit upward mobility, as residents struggle to save or invest due to high housing costs.
- Migration Trends: Unaffordable housing markets may drive residents to relocate to more affordable areas, influencing population shifts and economic growth.
- Local Economies: In regions with high ratios, workers may need to commute longer distances, impacting productivity and infrastructure demands.
Policy and Market Considerations
The current home price to income ratio of 6.26 in the western United States underscores the need for:
- Increasing Housing Supply:
- Build more affordable housing units, particularly in high-demand areas.
- Reform zoning laws to allow for higher-density housing.
- Boosting Income Levels:
- Promote economic policies that support wage growth, especially in industries outside of tech.
- Expanding Homeownership Support:
- Offer subsidies, tax incentives, or down payment assistance for first-time buyers.
Conclusion
The home price-to-income ratio is a powerful tool for understanding housing affordability. By analyzing and visualizing this metric, we can uncover regional disparities, highlight areas of concern—such as the significant challenges in the western United States—and guide targeted interventions. Whether you’re a policymaker, a business leader, or a concerned resident, this data provides the foundation for building more affordable and equitable communities.
The current mean ratio of 6.26 in the western United States is a strong indicator of significant housing affordability challenges in the western United States. This value far exceeds the affordability benchmark of 3:1, highlighting the growing economic burden of housing in this region. Policymakers, communities, and the private sector must address these issues to create more equitable and sustainable housing markets.
Housing affordability is a complex challenge, but with the right data and tools, we can take meaningful steps toward addressing it. Stay tuned for interactive maps and visualizations that bring this data to life!
[/et_pb_text][/et_pb_column][/et_pb_row][/et_pb_section]
