Introduction
The United States housing market has experienced significant shifts in recent years, with some regions seeing dramatic changes in affordability. Using data on home prices, adjusted for inflation, and median household incomes, this analysis maps the change in the home price-to-income ratio from 2017 to 2022. The findings highlight regional disparities and provide valuable insights for policymakers, urban planners, and residents.
Key Findings
- Western United States: Affordability Challenges Intensify
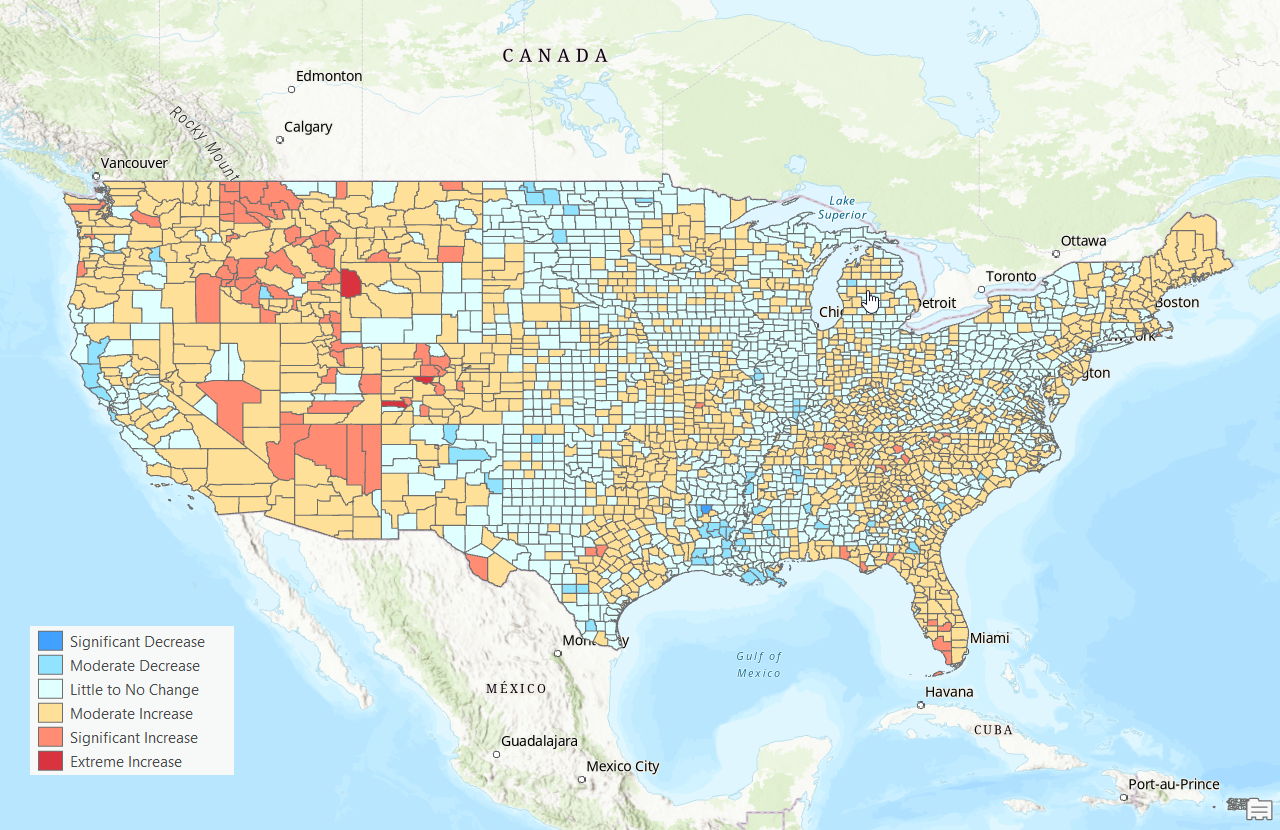
- The western U.S. shows widespread moderate to extreme increases in the home price-to-income ratio from 2017 to 2022. States like California, Nevada, Utah, and Arizona stand out, with several counties experiencing “Extreme Increases” (red on the map).
- Likely drivers include population growth, a booming housing market, and constrained housing supply.
- Midwestern Stability
- The Midwest remains a region of stability, with most counties showing “Little to No Change” (yellow) or only “Moderate Increases” (light orange).
- This suggests that housing prices in these areas have generally kept pace with inflation-adjusted income growth, maintaining affordability.
- Eastern United States: Mixed Trends with Hotspots
- The East Coast exhibits moderate increases in most areas, with some states, including Tennessee (TN), North Carolina (NC), Florida (FL), and Virginia (VA), experiencing “Significant Increases” (orange-red).
- Coastal states, known for higher population densities and demand, are more prone to affordability challenges compared to inland areas.
- Notable Hotspots
- Certain counties across the country stand out for their Extreme Increases, which likely stem from localized factors such as rapid economic growth, urbanization, or housing shortages. Further investigation into these areas could provide insights into the underlying causes.
Visual Analysis
The accompanying graduated color map (above) categorizes counties into six levels of change in the home price-to-income ratio from 2017 to 2022:

- Significant Decrease (blue) -2.0 or greater
- Moderate Decrease (light blue) -2.0 to -0.5
- Little to No Change (yellow) -0.5 to 0.5
- Moderate Increase (light orange) 0.5 to 2.0
- Significant Increase (orange-red) 2.0 to 5.0
- Extreme Increase (red) 5.0+
The map visually emphasizes the stark regional disparities in housing affordability trends over the five-year period. Western states dominate the higher increase categories, while the Midwest and parts of the South remain relatively stable.
Implications for Policy and Planning
- Western States: Targeted interventions to increase housing supply and improve affordability are crucial. Addressing regulatory barriers and investing in affordable housing could mitigate these challenges.
- Midwest: Continued investment in infrastructure and economic development could help maintain affordability while attracting growth.
- Eastern Hotspots: States with significant increases should focus on policies to balance housing demand with supply, particularly in rapidly growing metro areas.
Conclusion
This analysis underscores the importance of understanding regional trends in housing affordability. By examining changes in the home price-to-income ratio, adjusted for inflation, we can identify areas where affordability pressures are mounting and develop strategies to address them. The findings serve as a call to action for policymakers, planners, and stakeholders to ensure that housing remains accessible and equitable for all Americans.
