What five years of Census data say about where the Triangle’s boom actually landed
By Eric Pimpler. Every number below was pulled with Census Studio in an afternoon; the tool and the settings behind each one are at the end.
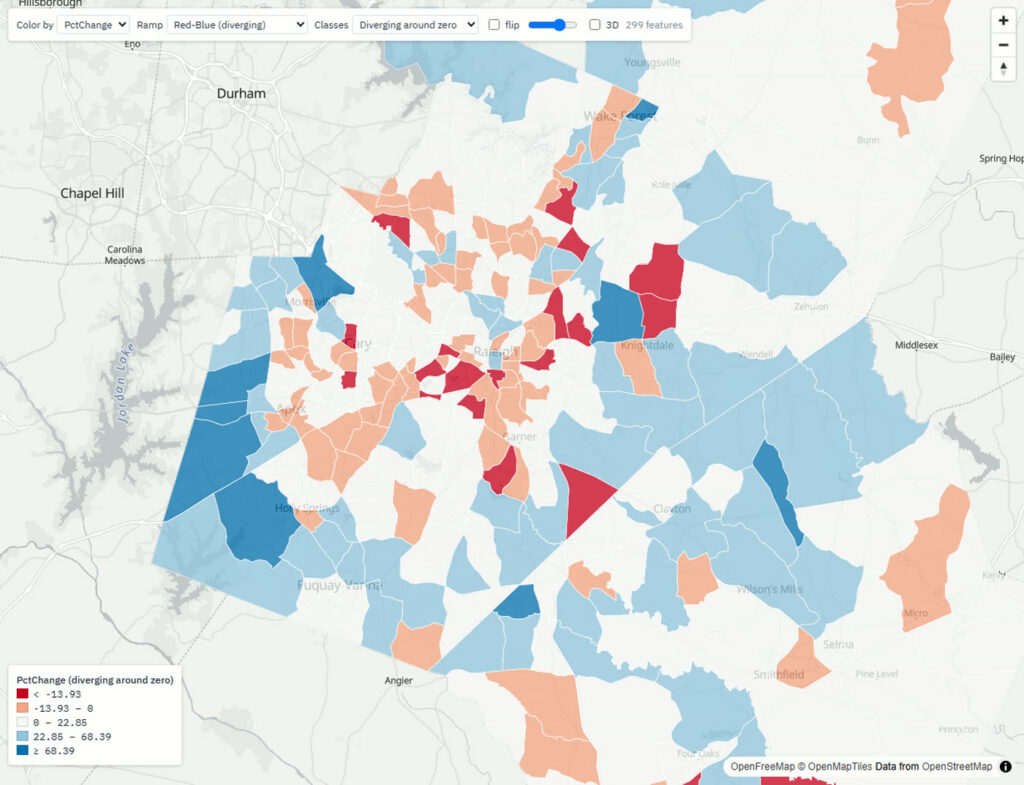
The Raleigh metro, Wake, Johnston and Franklin counties, added 147,000 people between the 2014-2018 and 2019-2023 American Community Survey windows, an 11.3 percent rise. That is the size of a mid-sized city arriving in five years. The tract-level data show it arrived in a ring: Apex, Cary’s southern edge, Wake Forest and Clayton, while 95 of the metro’s 299 tracts, 83 of them inside Wake County, lost population.
Percent population change by census tract, 2018 to 2023. Warm colours shrank, cool colours grew; the palest class is modest growth.
1. One Apex tract added more people than some counties
Johnston County grew fastest, 18.5 percent, adding 35,500 people. Wake grew 10 percent and added 104,500. Franklin grew 10.9 percent. But the growth inside Wake was anything but even.
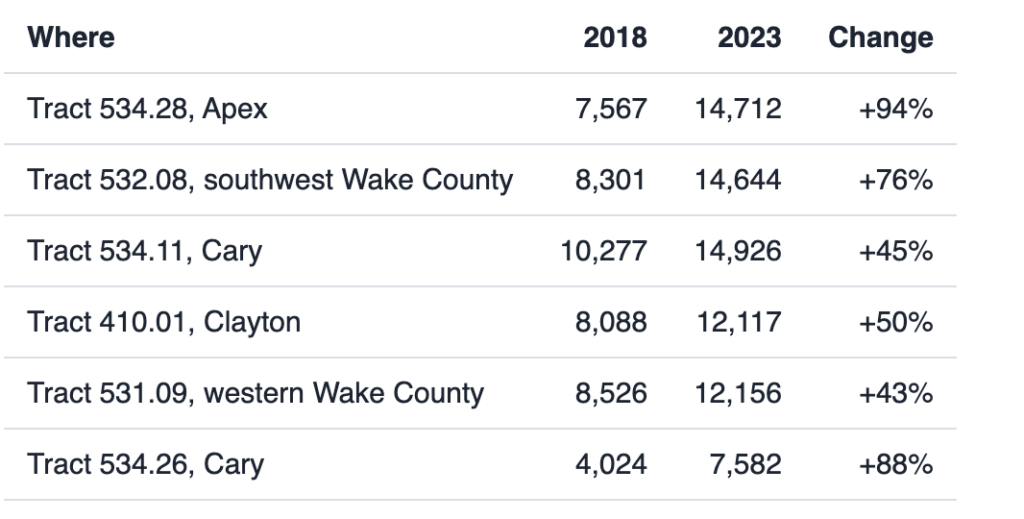
Sixty tracts grew by a quarter or more and together added 121,000 people, more than four fifths of the metro’s growth. Two Apex tracts doubled. A Wake Forest tract grew 83 percent, as did one near Flowers in Johnston County.
The other side of the ledger: 95 tracts shrank, 38,400 people between them. Cary’s tract 535.19 lost 36 percent, Wilders Grove in east Raleigh 22 percent, and a north Raleigh tract 23 percent. Some of that is redevelopment and some is demographic, households ageing in place with children gone, but the pattern is consistent: the established interior thinned while the frontier filled.
2. Movers stay close: Durham first, then Johnston
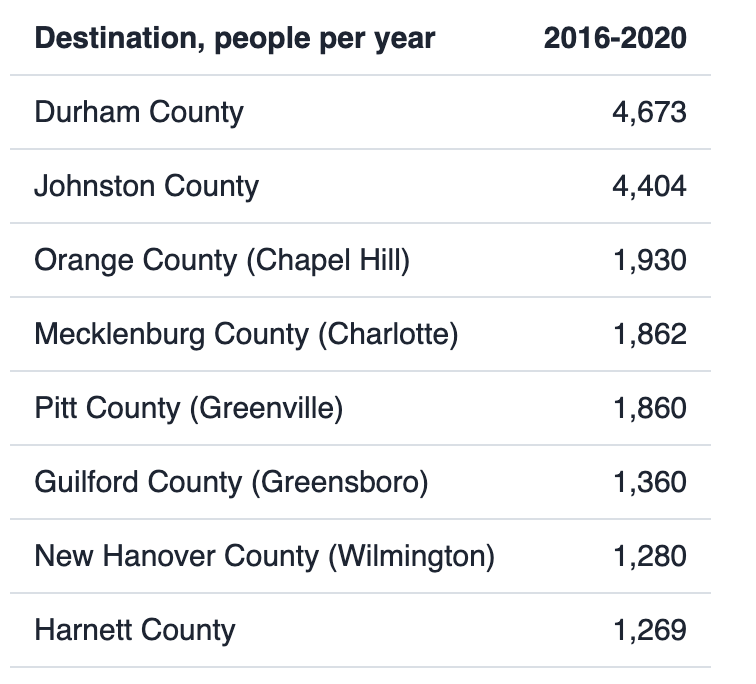
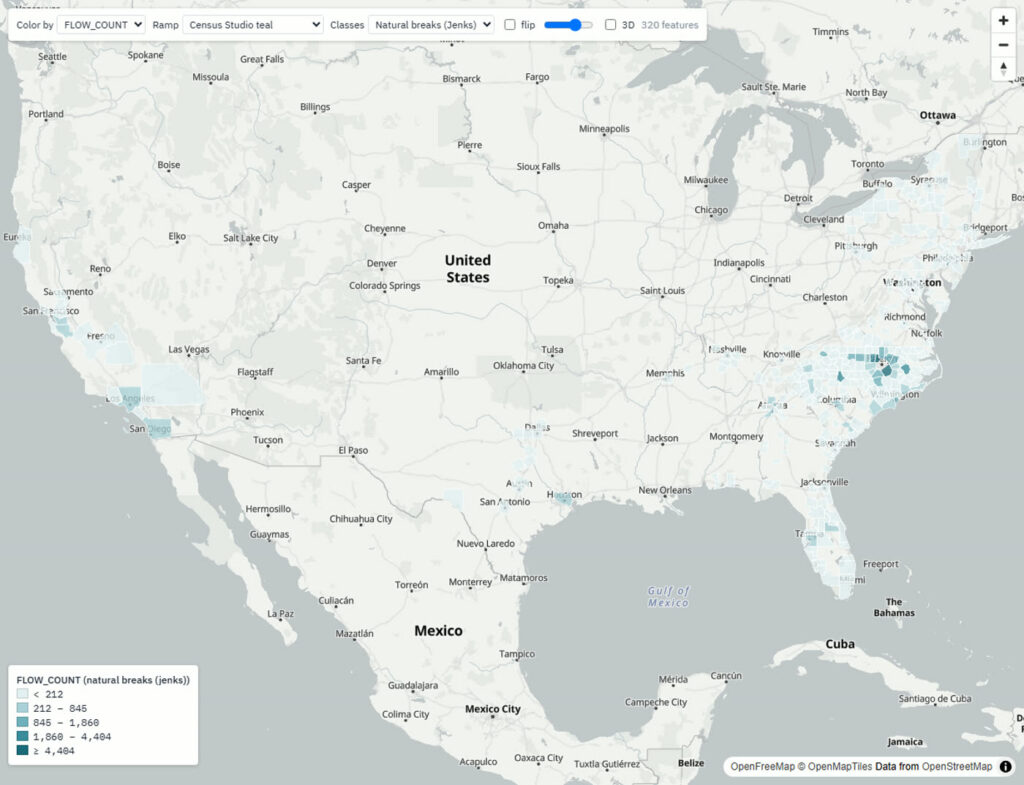
The Census Bureau’s 2016-2020 county-to-county flows, the last vintage that names both counties, show 48,500 people a year leaving Wake County for a county in the twelve states checked. Seventy percent of them stayed in North Carolina.
Johnston sent 3,607 a year back to Wake, so the net drift from Wake to Johnston was about 800 a year. Out of state, Florida took 2,400, Virginia 2,200, Georgia 2,100, California 1,900 and South Carolina 1,600. The Triangle’s internal churn, Wake to Durham to Orange and back, dwarfs anything leaving the state.
Where people leaving Wake County went, 2016 to 2020. Destination counties shaded by the number arriving each year.
3. Home values rose 58 percent, and Cary's cheapest tracts rose most
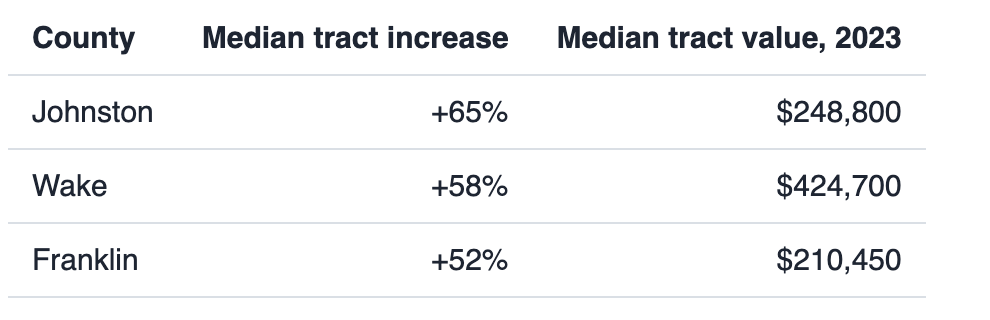
The typical tract’s median home value went from $221,000 to $372,200 in five years. Two thirds of tracts rose at least 50 percent; one in four rose at least 75 percent; only one percent fell.
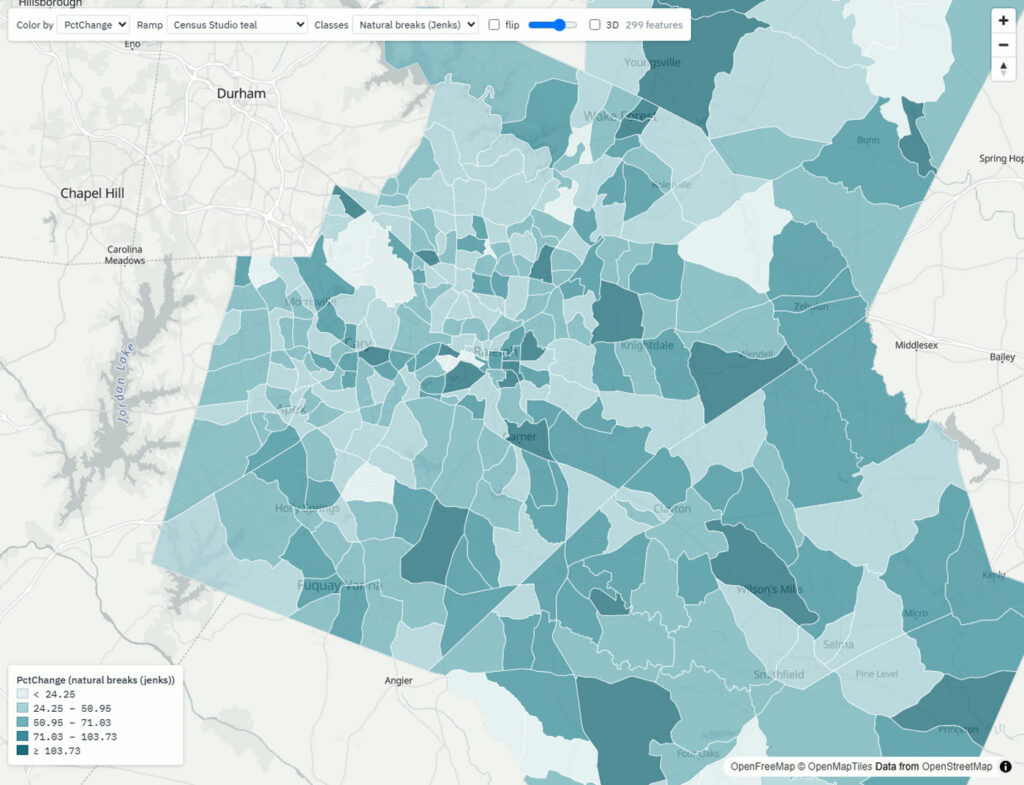
The steepest climbs were in tracts that started cheap and were rebuilt: a Cary tract from $123,700 to $345,300 (+179%), a Raleigh tract from $173,800 to $465,500, Mini City in north Raleigh from $145,000 to $365,600, and Brier Creek from $316,500 to $757,400. At the top of the market are Raleigh’s inside-the-beltline neighbourhoods: Oberlin at $1.09 million, Five Points at $1.00 million, North Hills at $953,000. At the bottom, Centerville in Franklin County at $118,000 and a rural Johnston tract at $119,400.
Percent change in median home value by tract, 2018 to 2023.
4. Income is a west-of-Raleigh phenomenon
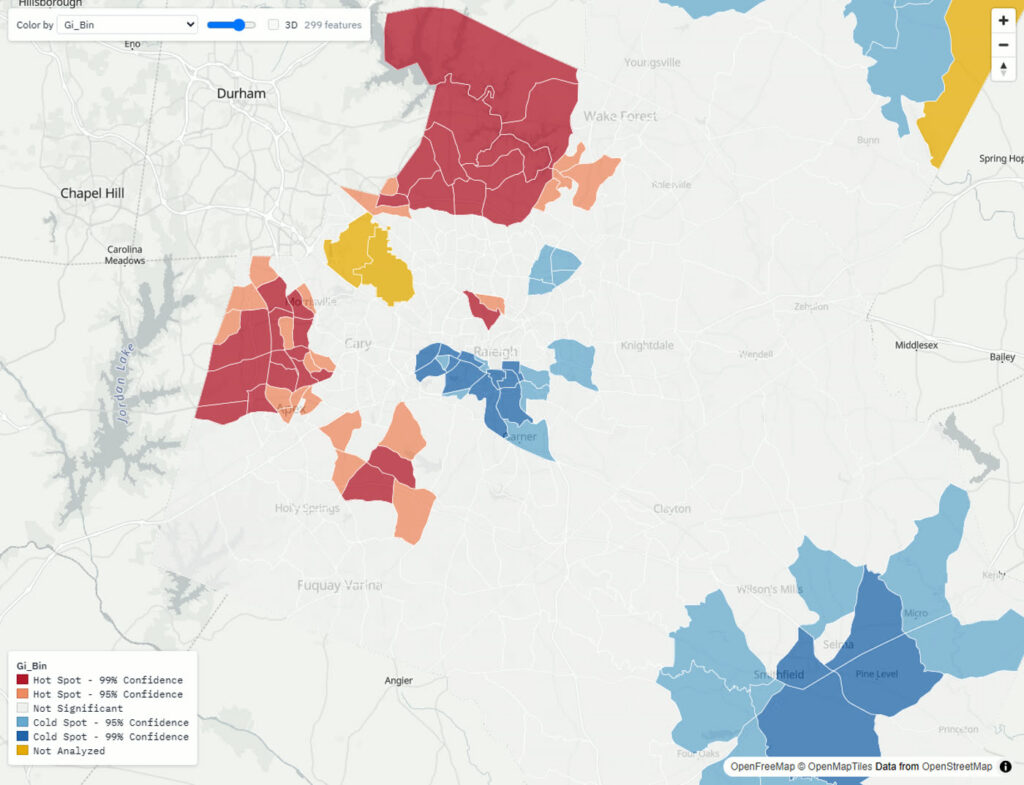
A Getis-Ord hot spot analysis of median household income, adjusted for margins of error, finds 48 statistically significant hot tracts and 39 cold ones, an unusually sharp split.
The hot spots are Cary, Apex and northwest Wake: tract 539.01 at $203,000, Bayleaf at $168,000, two Cary tracts at $168,000 and $144,000. The cold spots are southeast and east Raleigh (Caraleigh at $46,000, two tracts near downtown at $30,000) and the older parts of Johnston County.
Income hot spots and cold spots by tract, 2023 five-year estimates.
The metro’s median household income is $102,569, far above North Carolina’s $69,904 and the nation’s $78,538. Half of its adults hold a bachelor’s degree, against 35 percent nationally; in Wake County it is 56 percent. The poverty rate is 8.6 percent, versus 13.2 statewide. Wake County’s median tract income is $102,084; Johnston’s is $82,750; Franklin’s is $61,319.
5. Johnston County drives to Wake
Forty-four percent of Johnston County’s employed residents, 46,000 of 105,000, work in Wake County. Only 23 percent work in Johnston itself, and 6 percent commute to Durham. From the other direction, 64 percent of Wake’s workers stay in Wake and 15 percent go to Durham County, the Research Triangle Park effect.
Tenure follows price. Johnston and Franklin are 77 and 78 percent owner-occupied with median rents under $1,000; Wake is 64 percent owner-occupied with a median tract rent of $1,552.
What it adds up to
Raleigh’s five years were a frontier story. Four fifths of the growth went to sixty tracts on the metro’s western and southern edges, Apex and Cary first, then Wake Forest and Clayton, while the established interior lost 38,000 people. House prices rose 58 percent and fastest where they had been lowest. The highest incomes sit west of the city in Cary and Apex, the lowest in southeast Raleigh and old Johnston. And Johnston County, growing fastest of all, sends nearly half its workers into Wake every morning. For anyone planning in the Triangle, the frontier is the whole story, and the data say exactly which tracts it runs through.
How this was made
All data are U.S. Census Bureau: ACS 5-year estimates (2014-2018 and 2019-2023), ACS county-to-county migration flows (2016-2020), and LEHD Origin-Destination Employment Statistics (2022). Each dataset was pulled and analysed in Census Studio, a browser tool that runs the Census Studio ArcGIS Pro toolbox workflows without ArcGIS or R.
Compare Time Periods, B01003_001 (total population) and B25077_001 (median home value), tracts, Wake, Johnston and Franklin counties, 2018 against 2023; 2018 estimates interpolated onto the 2020 tract boundaries. One credit each.
Download ACS Census Data, 2023 five-year, tracts: population, median household income, median home value, median gross rent, tenure. One credit.
Hot Spot Analysis on median household income with its margin of error, contiguity neighbours, 95 percent significance. One credit.
Download Migration Flows, origin Wake County and origin Johnston County, 2016-2020. One credit each.
Download LEHD Commute Flows, home county Johnston and home county Wake, all jobs, 2022. One credit each.
Demographic Profile Report of the metro’s tracts against Wake County, North Carolina and the United States. Two credits.
Nine runs, eleven credits. Margins of error are carried through every step; tract-level medians are estimates, and the hot spot analysis takes their reliability into account. The 2016-2020 flows are the last county-to-county vintage the Bureau publishes; later releases give county-to-state flows only.
Census Studio is at censusstudio.com, with pricing, tutorials and a free account to try the tools used here.